Use the Ecommerce Dashboard
The Ecommerce Dashboard is your single destination for partner performance insights across Rokt Ecommerce products (e.g., Rokt Thanks, Rokt Pay+). It gives you quick insight into the performance of your Rokt integration and performance trends.
AccessDirect link to Access
You can access the Ecommerce Dashboard to monitor the performance of all key metrics. The data is refreshed hourly. Note that what's displayed is an indication, and final revenue is confirmed in your monthly invoice.
- Log in to my.rokt.com
- Navigate to your account.
- Click Transactions.
- Click Ecommerce Dashboard.
- You arrive directly on the Ecommerce Dashboard, where you can view and export performance reports.
Manage your dashboardDirect link to Manage your dashboard
- Log in to my.rokt.com
- Navigate to your account.
- Click Transactions.
- Click Ecommerce Dashboard.
Filter data by segmentDirect link to Filter data by segment
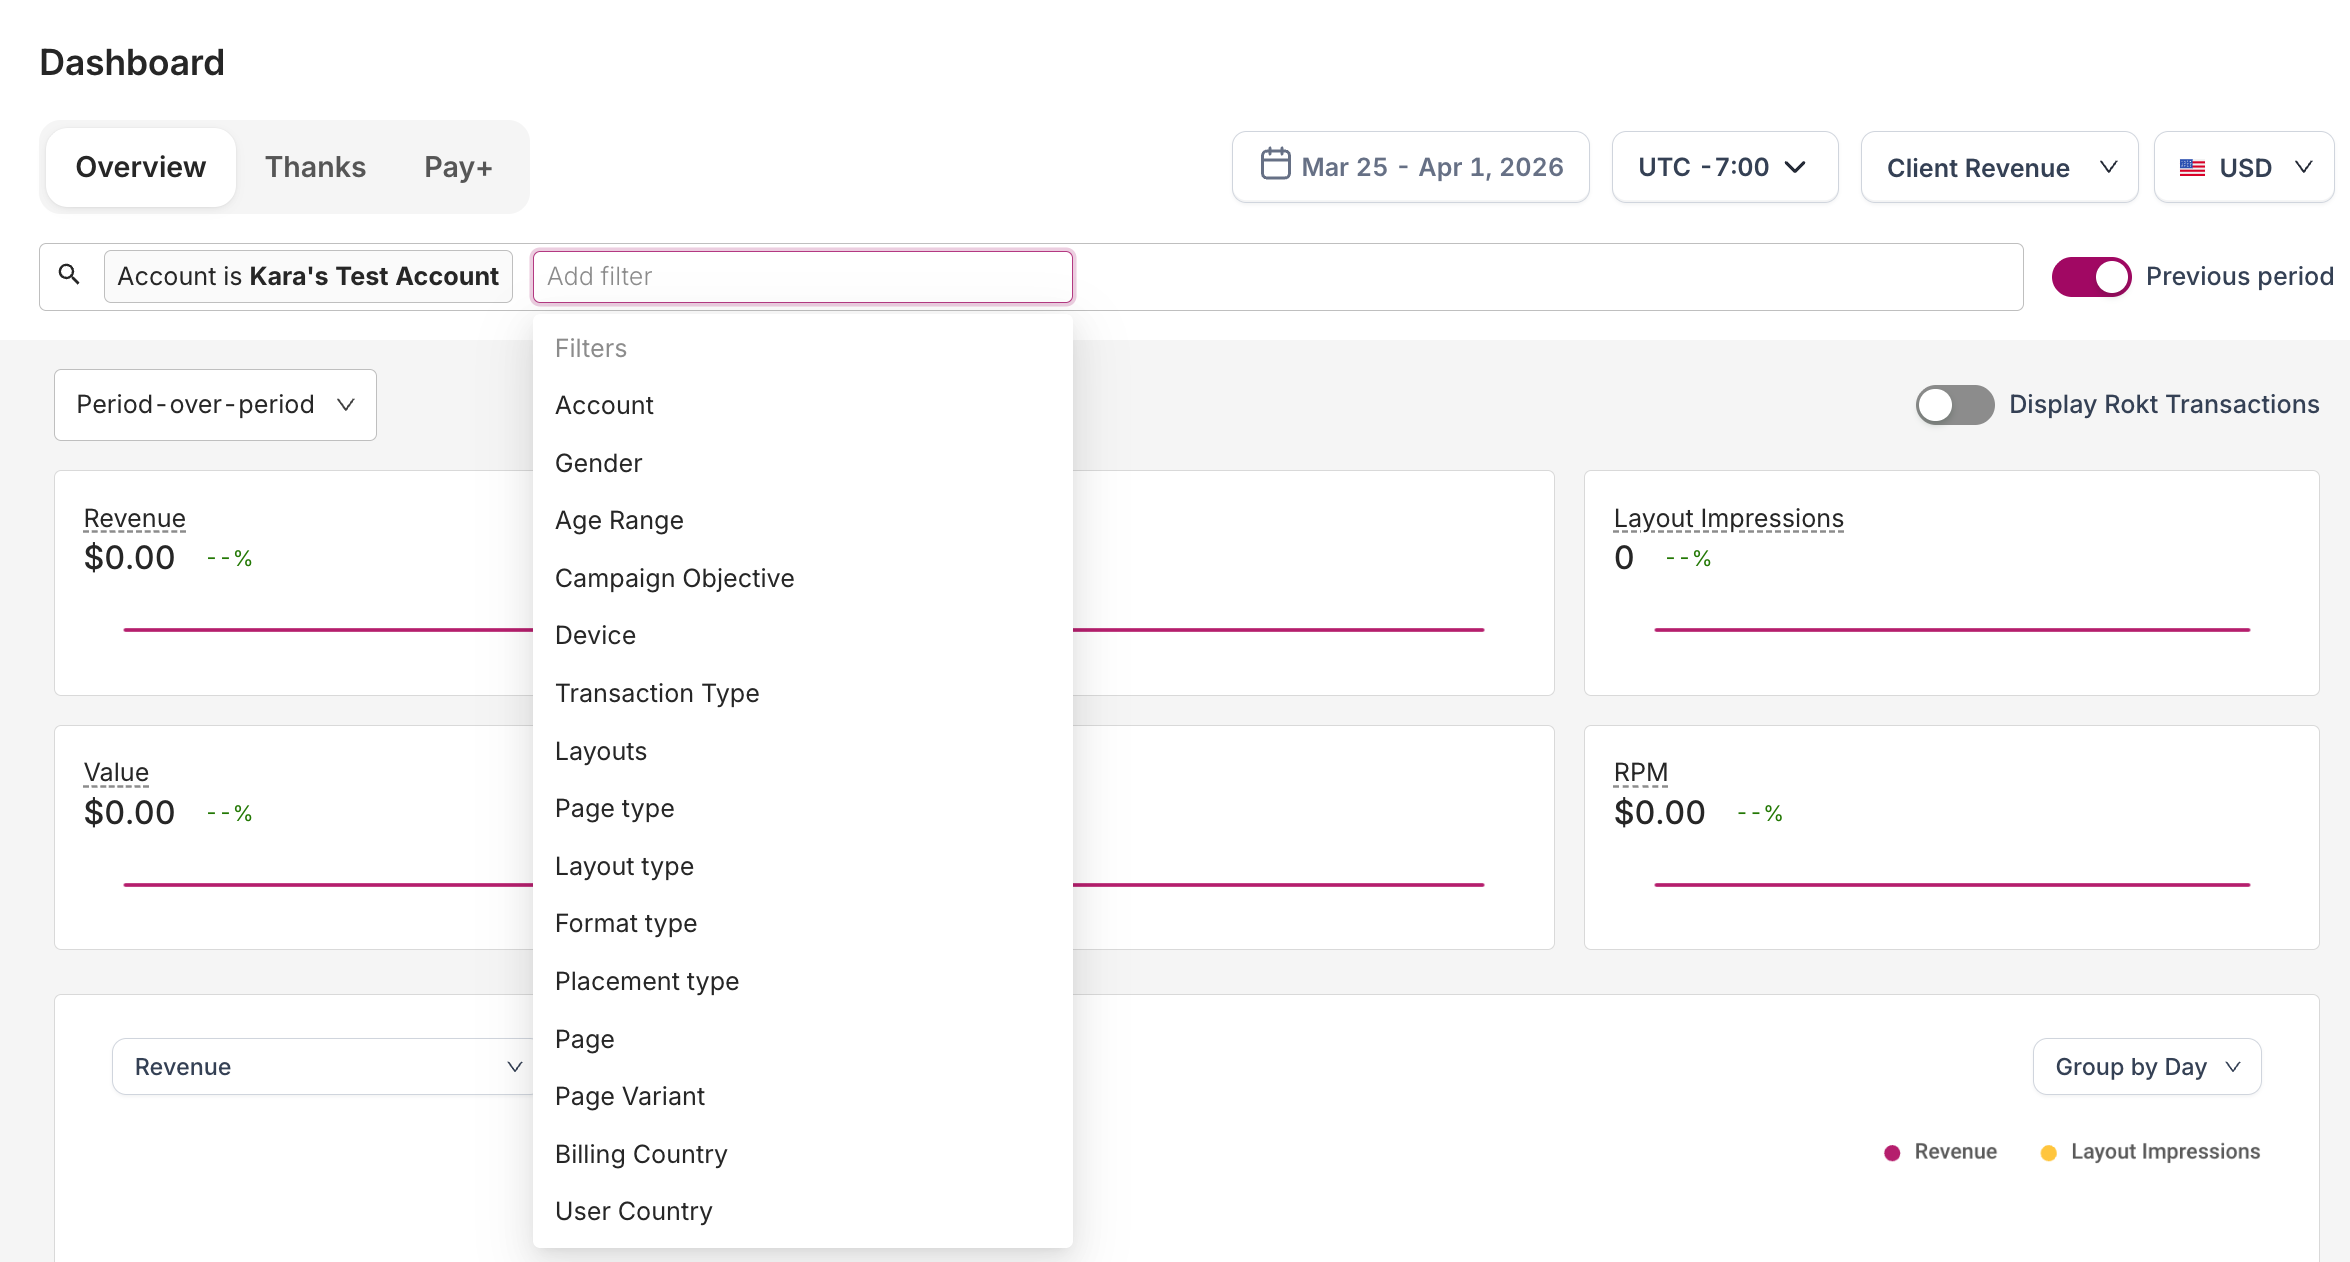
The filter bar at the top of the Ecommerce Dashboard allows you to filter the data and customize segmented views.
The available filters include account, gender, age range, campaign objective, device, transaction type, layouts, page type, layout type, format type, placement type, page, page variant, billing country, and user country.
Customize the time periodDirect link to Customize the time period
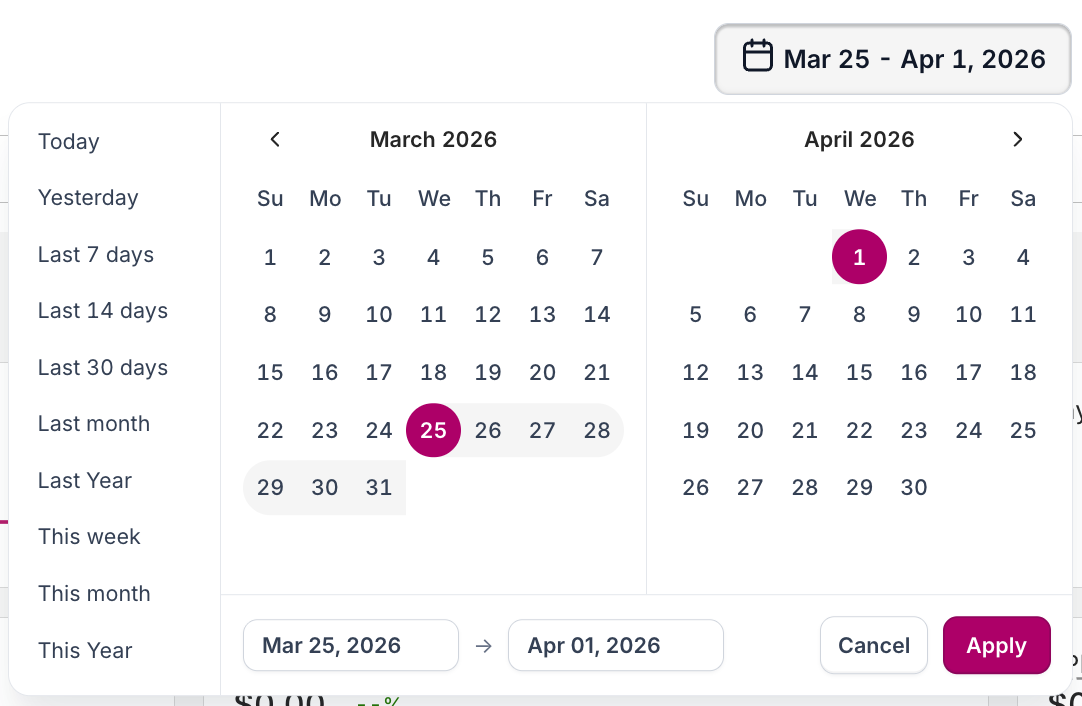
Click the date range at the top of the dashboard and manually input specific dates or select a predefined date range. Click Apply.
Predefined date rangesDirect link to Predefined date ranges
- Today: Data available for the current calendar date up until the time of your selection.
- Yesterday: Data for the previous calendar date.
- This week: Data for the first day of the current week (Sunday) up until the time of your selection.
- Last 7 days: Data for the previous 7 days. Does not include the current calendar date.
- Last week: Data for the first to last day of the previous calendar week.
- This month: Data for the first day of the current calendar month up until the time of your selection.
- Last 30 days: Data for the previous 30 days. Does not include the current calendar date.
- Last month: Data for the first to last day of the previous calendar month.
- This quarter: Data for the first day of the current calendar quarter up until the time of your selection.
- Previous quarter: Data for the first to last day of the previous calendar quarter.
- Last year: Data for the first to last day of the previous calendar year.
- This year: Data for the first day of the current calendar year up until the time of your selection.
Change the time zoneDirect link to Change the time zone
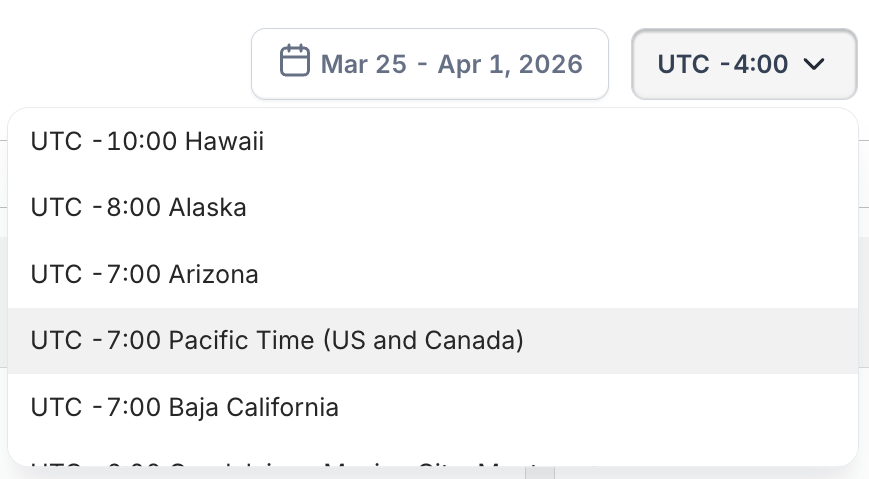
Click the time zone drop-down and select a different time zone.
Modify the currencyDirect link to Modify the currency
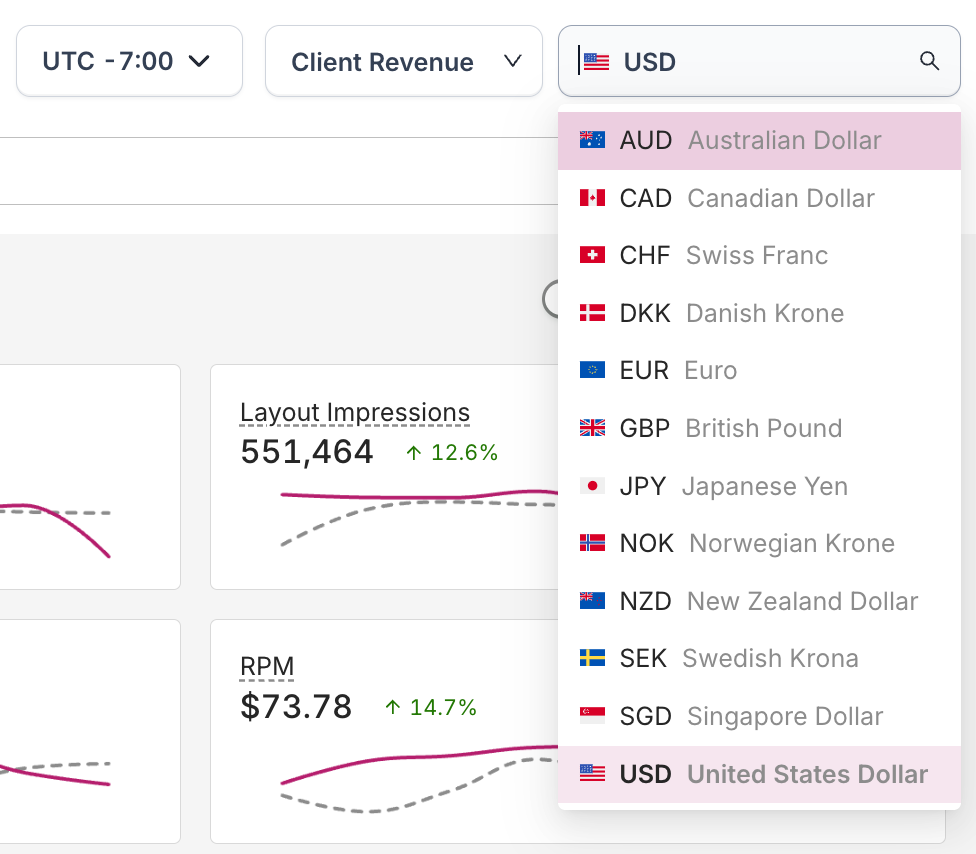
Click the currency drop-down and select the currency you want to display.
Previous time periodDirect link to Previous time period
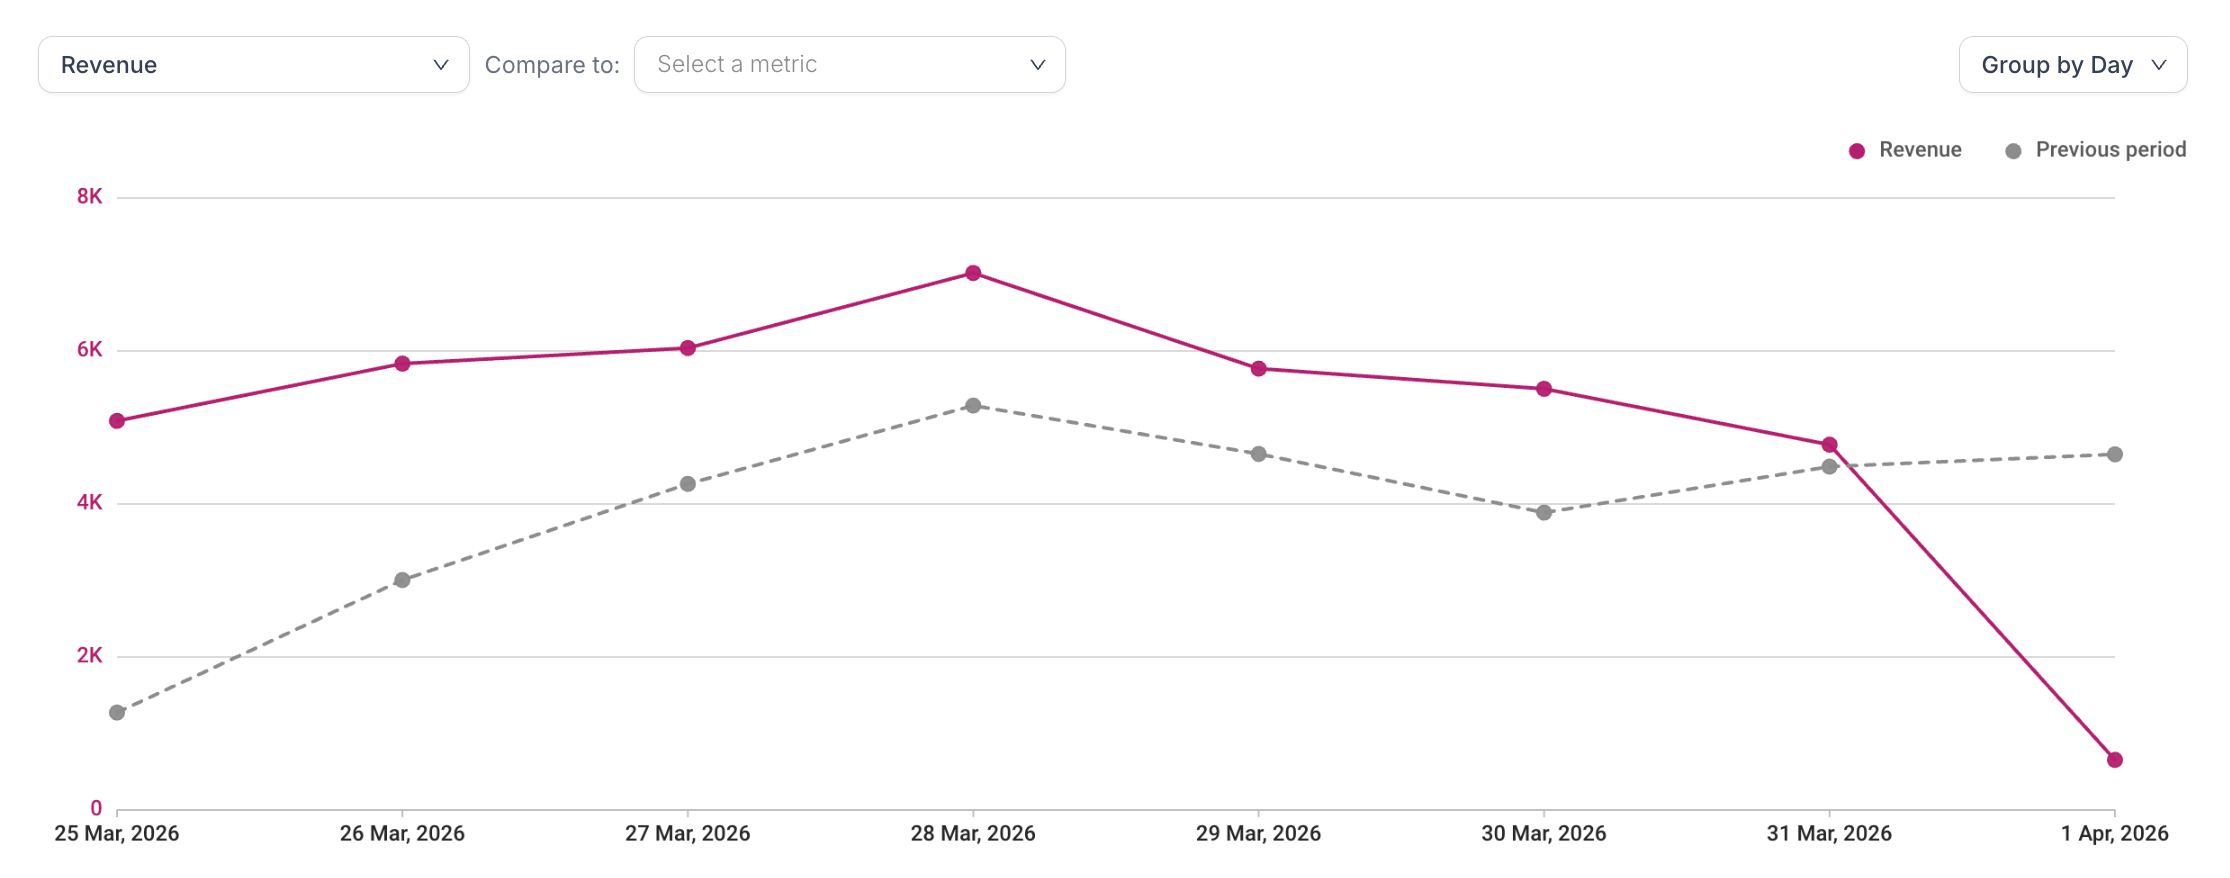
When viewing a single metric on the trend chart, a dotted line is shown as a comparison against the immediately previous time period. For example:
- If you're looking at a 24-hour time period for April 5th, the previous time period will show 24 hours for the April 4th.
- If you're looking at a 7-day time period for the last 7 days (March 30th to April 5th), the previous time period shows the previous 7 days (March 23rd to March 29th).
- If you're looking at a 31-day time period for the month of March (1st to 31st), the previous time period shows the previous 31 days (January 30th to February 29th).
Compare metricsDirect link to Compare metrics
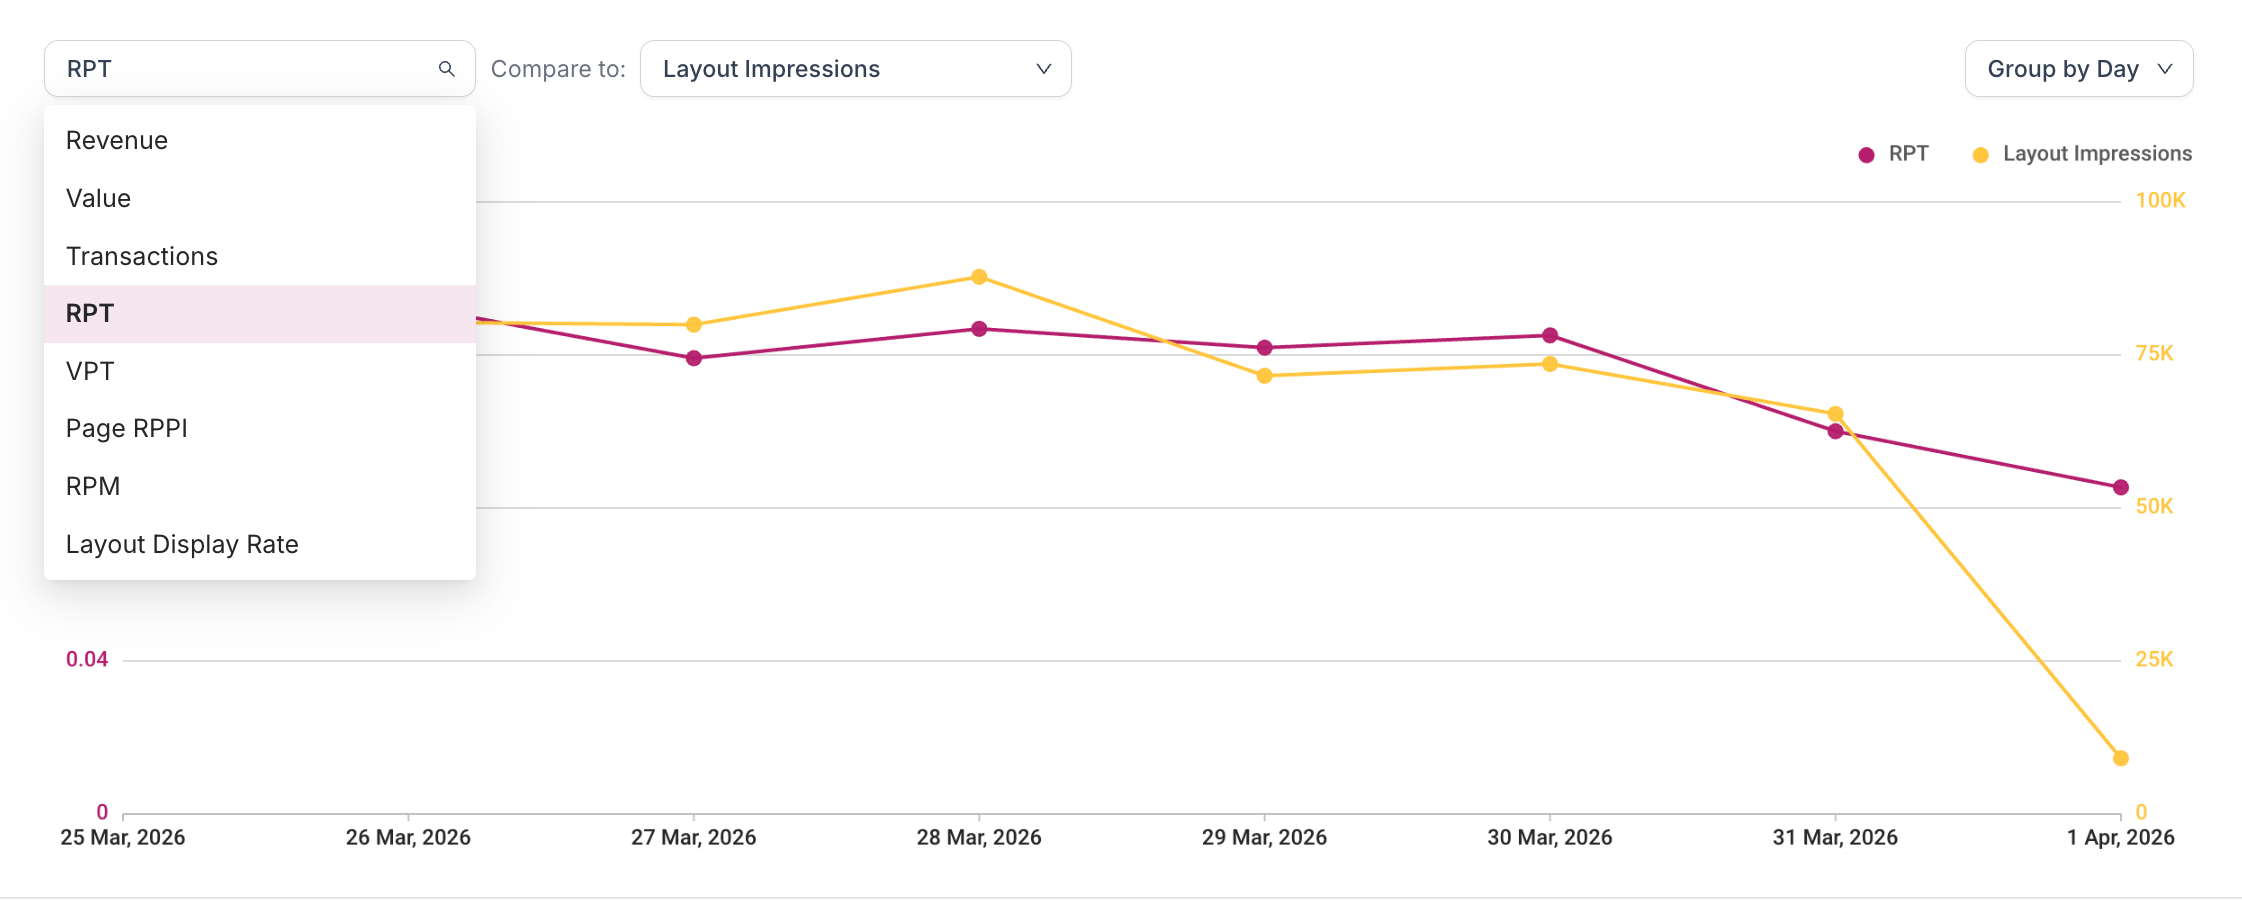
Click + compare to to display a comparison between two different metrics on the trend charts. Note: When multiple metrics are shown on the trend chart, the previous time period comparison is not displayed.