Use the transactions dashboard
The Transactions Dashboard is designed to give partners quick insight into the performance of your Rokt integration and the factors driving performance, as well as allow you to view trends and compare important metrics.
Access
You can access reporting to monitor the performance of all key metrics. The data is refreshed hourly. Note that what's displayed is an indication, and final revenue is confirmed in your monthly invoice.
- Log in to my.rokt.com
- Navigate to your account.
- Click Transactions.
- Click Transaction Dashboard.
- You arrive directly on the Transactions Dashboard, where you can find performance reports.
Manage your dashboard
- Log in to my.rokt.com
- Navigate to your account.
- Click Transactions.
- Click Transactions Dashboard.
Custom time period
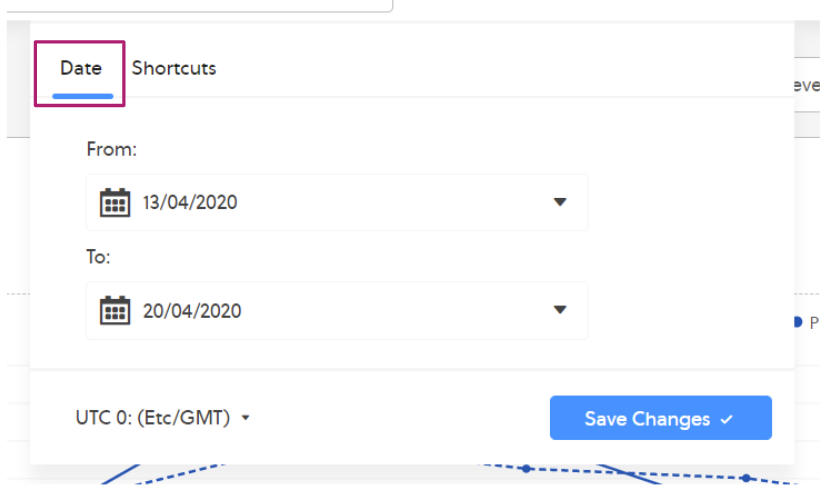
- Click the date range at the top of the dashboard and:
- Select a new date range from the Date tab or,
- Select from the predefined shortcuts in the Shortcuts tab.
- Click Save Changes.
Predefined shortcuts
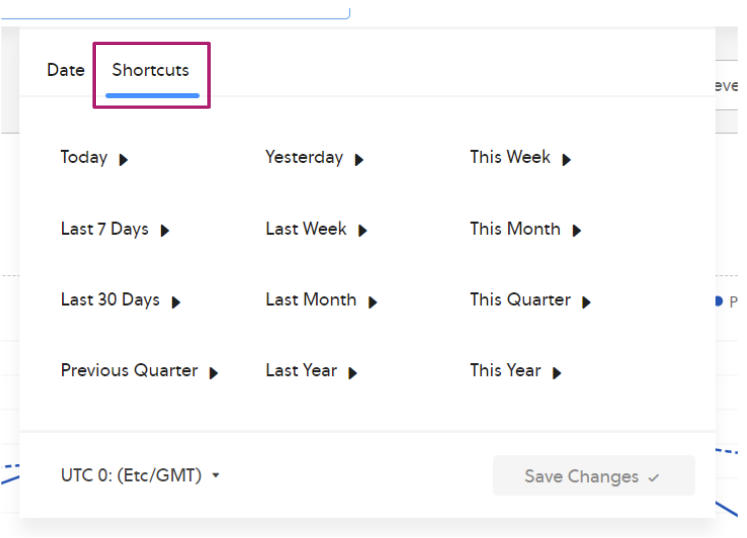
- Today: Data available for the current calendar date up until the time of your selection.
- Yesterday: Data for the previous calendar date.
- This week: Data for the first day of the current week (Sunday) up until the time of your selection.
- Last 7 days: Data for the previous 7 days. Does not include the current calendar date.
- Last week: Data for the first to last day of the previous calendar week.
- This month: Data for the first day of the current calendar month up until the time of your selection.
- Last 30 days: Data for the previous 30 days. Does not include the current calendar date.
- Last month: Data for the first to last day of the previous calendar month.
- This quarter: Data for the first day of the current calendar quarter up until the time of your selection.
- Previous quarter: Data for the first to last day of the previous calendar quarter.
- Last year: Data for the first to last day of the previous calendar year.
- This year: Data for the first day of the current calendar year up until the time of your selection.
Changing the time zone
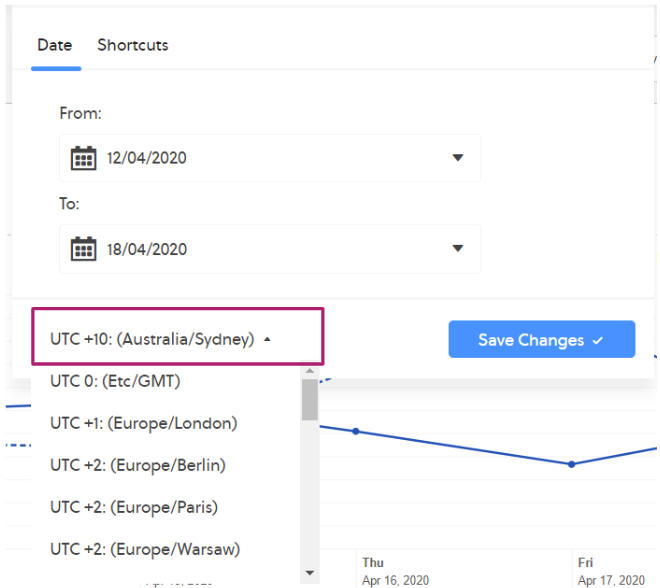
- Click the date range at the top of the dashboard.
- Click the time zone drop-down and select a different time zone.
- Click Save Changes.
Previous time period
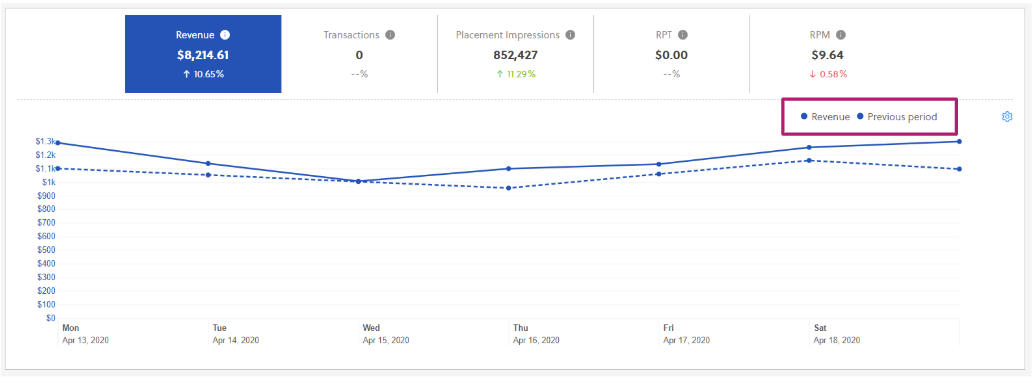
When viewing a single metric on the trending chart, a dotted line is shown as a comparison against the immediately previous time period. For example:
- If you're looking at a 24-hour time period for April 5th, the previous time period will show 24 hours for the April 4th.
- If you're looking at a 7-day time period for the last 7 days (March 30th to April 5th), the previous time period shows the previous 7 days (March 23rd to March 29th).
- If you're looking at a 31-day time period for the month of March (1st to 31st), the previous time period shows the previous 31 days (January 30th to February 29th).
Modify the currency
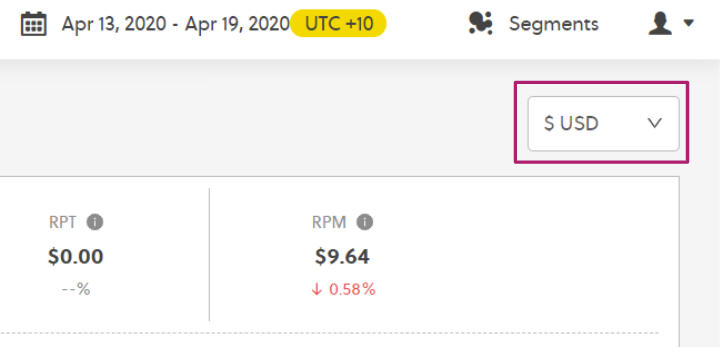
- Click the currency icon.
- Select the currency you want to display.
View multiple metrics
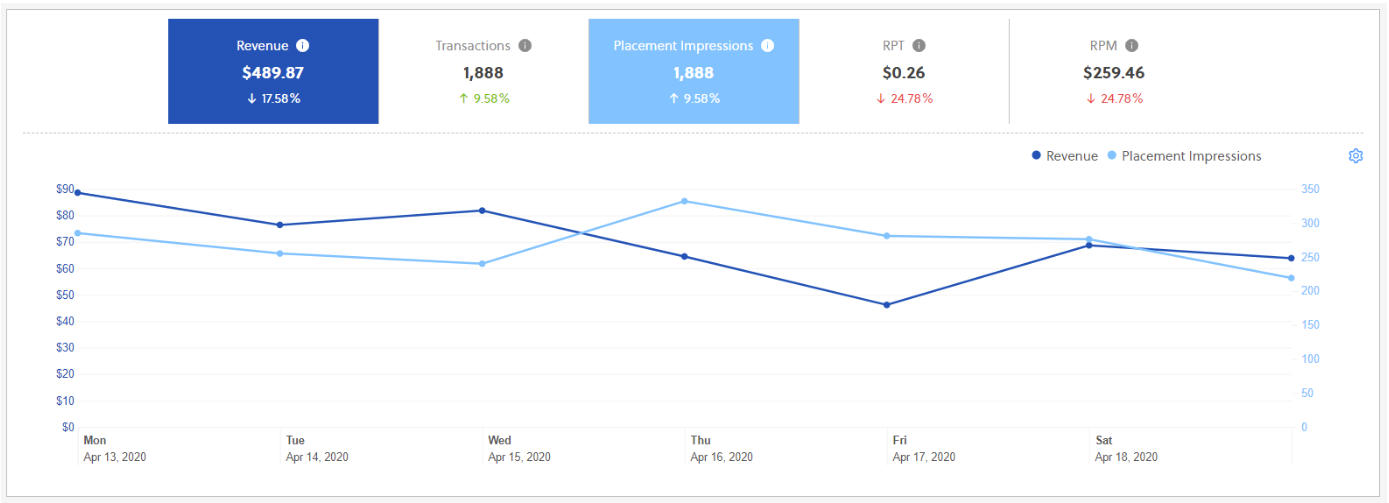
- Click the summary tiles at the top of the page to select and deselect additional metrics you want to show on the trend chart.
- When multiple metrics are shown on the trend chart, the previous time period comparison is hidden.
The y-axis is labeled for the first and second metrics on the left and right side of the chart, respectively. Any additional metrics will not be labelled.
Filter your results

The filter bar spanning the top of the screen allows you to filter the data displayed in the Transactions Dashboard.
The available filters include account, age range, campaign objective, country (account country), device, gender, page, page type, placement and placement type.