Placements reporting
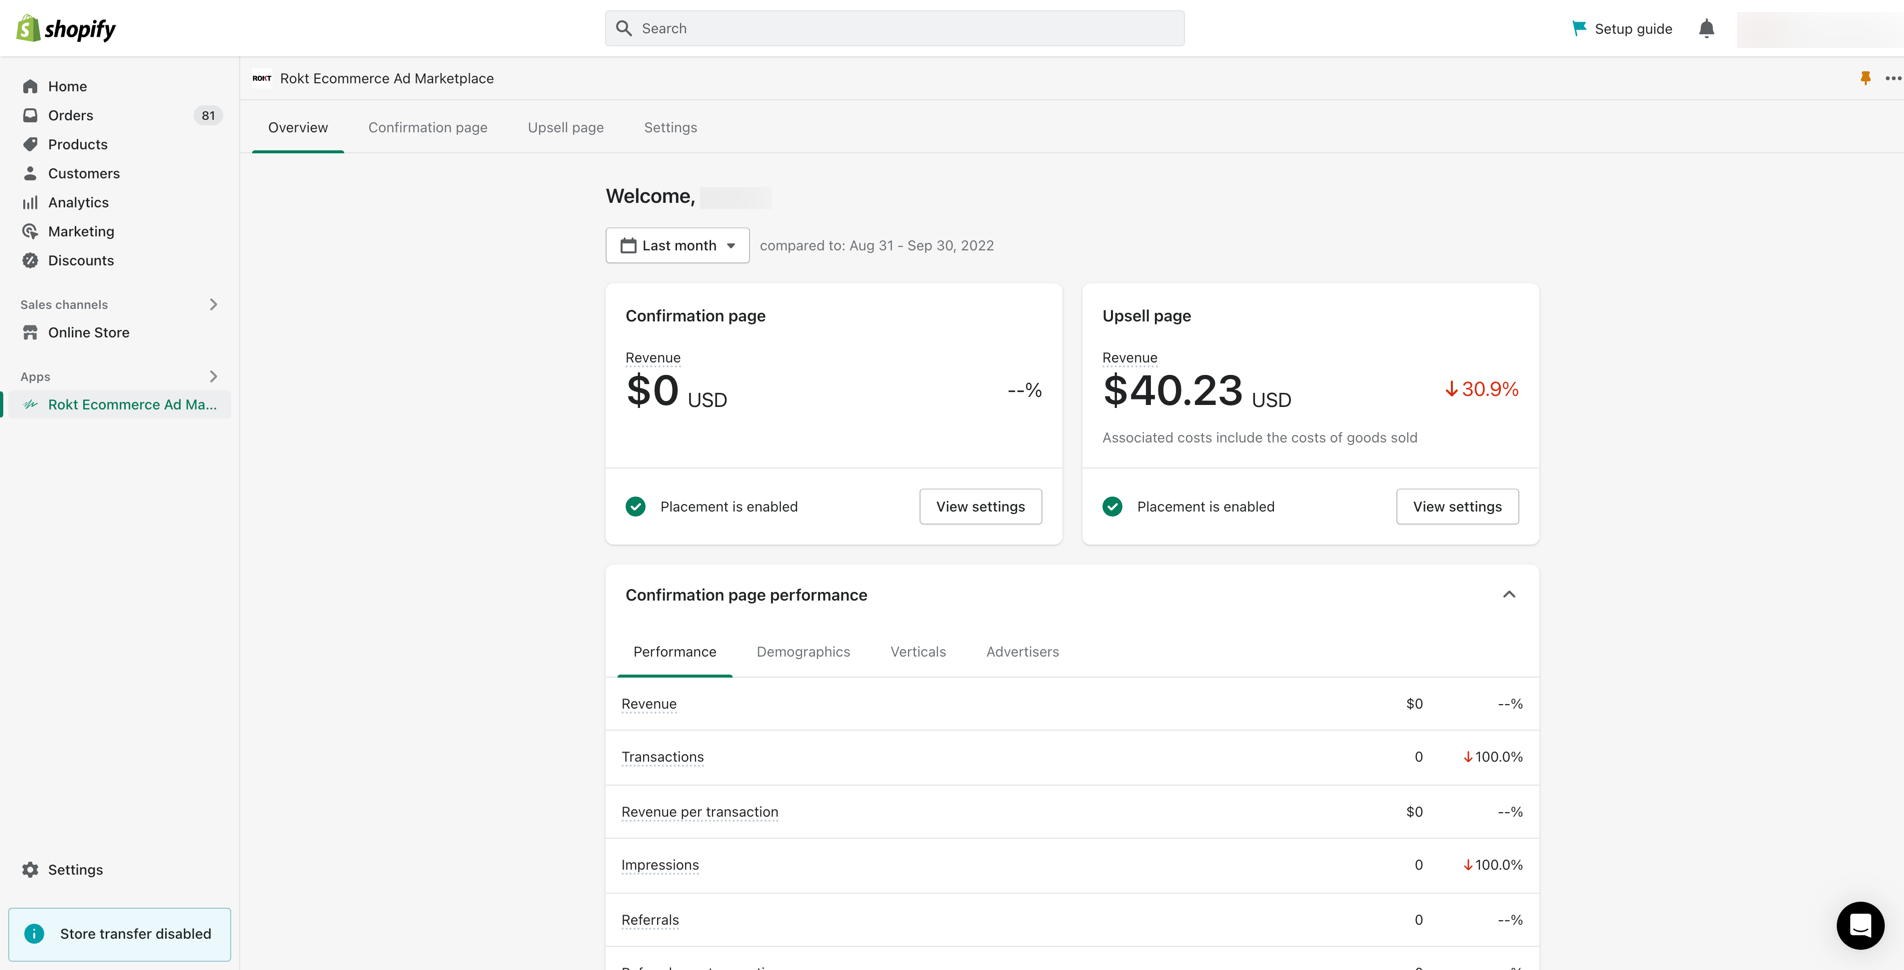
You can monitor your performance in the Overview tab.
Use the date picker to view performance metrics for a specific time period. A comparison against the time period immediately before is calculated for each metric. For example, if you’re viewing the Last 7 days (January 8 - 14), it will compare performance to the previous 7 days (January 1 - 7).
PerformanceDirect link to Performance
Monitor performance for your confirmation page placement with the following metrics.
RevenueDirect link to Revenue
Confirmation page revenue is generated every time a customer opts-in to an offer on your confirmation page by clicking ’Yes please’.
Your payout amount may differ from the reported revenue. See why.
TransactionsDirect link to Transactions
A transaction is recorded when a customer completes their purchase and the confirmation page placement is enabled. A transaction is also recorded when a customer returns to the confirmation page to view their order and positively engages with the placement.
Revenue per transactionDirect link to Revenue per transaction
The average amount of confirmation page revenue generated per transaction.
ImpressionsDirect link to Impressions
An offer impression is recorded for every Rokt offer that is displayed on your confirmation page. Each transaction can result in multiple impressions.
ReferralsDirect link to Referrals
A referral is recorded every time a customer opts-in to a Rokt offer by clicking ’Yes please’.
Referrals per transactionDirect link to Referrals per transaction
The average number of referrals per transaction. For example, 0.2 referrals per transaction means there were 2 referrals for every 10 transactions.
DemographicsDirect link to Demographics
View your revenue broken down by gender and age. This indicates which audience segments generate the most revenue by engaging with the offers on your confirmation page. You can also view transactions broken down by gender and age.
Top verticalsDirect link to Top verticals
View the verticals that your customers engage with the most, sorted from the verticals that receive the most referrals (clicks to opt-in to the offer) to the least referrals.
Referral rate is the rate at which customers engage with the offers, calculated as a percentage of referrals / impressions for that specific vertical.
Top advertisersDirect link to Top advertisers
View the advertisers that your customers engage with the most, sorted from the advertisers that receive the most referrals (clicks to opt-in to the offer) to the least referrals.
Referral rate is the rate at which customers engage with the offers, calculated as a percentage of referrals / impressions for that specific advertiser.